
Cancun Weather Averages
Cancun is warm all year, but the averages change enough to shape how a trip feels. Long-term averages show that January is the coolest month and August is the hottest. March and April are the driest months, while September and October are the wettest pair.

May is still my favorite time of year in Cancun: it is hot, the sea is warm and the heavier summer rain has not yet arrived. Your ideal month may be different, so use the tables below to compare heat, rain, humidity, wind and sea temperature before opening the detailed guide for your travel month.
These are long-term averages, not a forecast. Conditions can vary from one year or week to another, and from one part of Cancun to another.
Cancun Weather Month by Month
For the seasonal context behind storm risk, see the Cancun hurricane season guide.
Cancun Weather Averages by Month
Temperature and hot days
| Month | Avg high | Avg low | Avg mean | Days > 80°F | Days > 90°F |
|---|---|---|---|---|---|
| January | 84°F / 29°C | 68°F / 20°C | 76°F / 24°C | 24 | 2 |
| February | 86°F / 30°C | 69°F / 21°C | 78°F / 25°C | 24 | 6 |
| March | 89°F / 32°C | 71°F / 21°C | 80°F / 26°C | 29 | 12 |
| April | 92°F / 33°C | 73°F / 23°C | 82°F / 28°C | 30 | 20 |
| May | 94°F / 34°C | 76°F / 24°C | 85°F / 29°C | 31 | 26 |
| June | 93°F / 34°C | 77°F / 25°C | 85°F / 30°C | 30 | 24 |
| July | 95°F / 35°C | 77°F / 25°C | 86°F / 30°C | 31 | 28 |
| August | 95°F / 35°C | 77°F / 25°C | 86°F / 30°C | 31 | 28 |
| September | 94°F / 34°C | 76°F / 25°C | 85°F / 29°C | 30 | 25 |
| October | 90°F / 32°C | 75°F / 24°C | 82°F / 28°C | 30 | 15 |
| November | 87°F / 30°C | 72°F / 22°C | 79°F / 26°C | 27 | 6 |
| December | 85°F / 29°C | 70°F / 21°C | 77°F / 25°C | 26 | 4 |
“Days above” figures are rounded estimates based on long-term daily temperature records. They show typical conditions, not a guarantee for a particular trip.
Rain, humidity and wind
| Month | Rainfall | Days with rain | Avg humidity* | Avg wind* |
|---|---|---|---|---|
| January | 4.1 in / 104 mm | 11 | 76% | 8 mph / 13 km/h |
| February | 2.3 in / 59 mm | 7 | 75% | 8 mph / 13 km/h |
| March | 1.5 in / 39 mm | 5 | 72% | 8 mph / 13 km/h |
| April | 1.7 in / 42 mm | 4 | 73% | 8 mph / 13 km/h |
| May | 3.4 in / 87 mm | 8 | 74% | 8 mph / 12 km/h |
| June | 7.3 in / 184 mm | 12 | 81% | 7 mph / 11 km/h |
| July | 2.6 in / 67 mm | 9 | 80% | 6 mph / 10 km/h |
| August | 4.0 in / 102 mm | 12 | 80% | 6 mph / 10 km/h |
| September | 7.2 in / 182 mm | 15 | 82% | 6 mph / 10 km/h |
| October | 10.9 in / 277 mm | 18 | 83% | 7 mph / 11 km/h |
| November | 5.2 in / 131 mm | 13 | 79% | 8 mph / 13 km/h |
| December | 3.8 in / 97 mm | 12 | 78% | 8 mph / 12 km/h |
Humidity and wind are long-term estimates for Cancun. Actual conditions vary by location and date.
Cancun Temperatures Through the Year
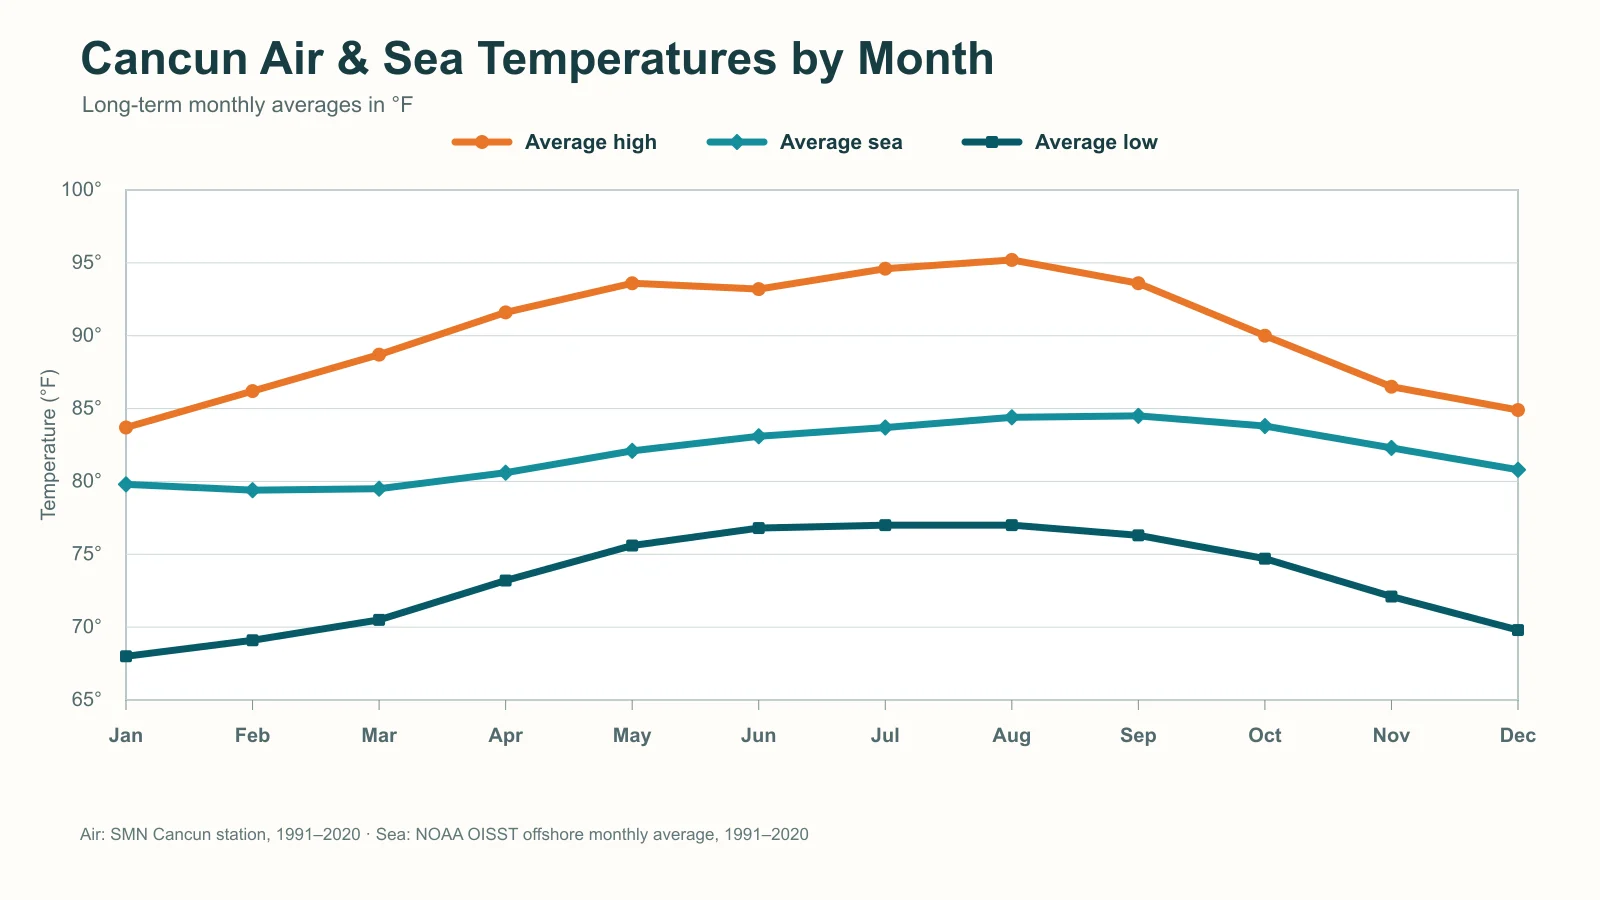
Cancun’s average daytime high rises from 84°F (29°C) in January to 95°F (35°C) in August. Average nights range from 68°F (20°C) in January to 77°F (25°C) in July and August.
January is the coolest month overall, although it still averages about 24 days with a high above 80°F. The heat builds through spring, and average highs exceed 90°F from April through September. July and August both average about 28 days above 90°F, while August has the highest average daytime temperature.
Rainfall: Wet and Dry Months
March is the driest month in the current station normal, closely followed by April. June marks a sharp increase in rain. July is notably drier, then rainfall builds again through August and September before reaching its annual peak in October.
October averages 10.9 inches (277 mm) of rain across about 18 rain days. That does not mean it rains all day for 18 days: a rain day can include a short shower, and rainfall can differ between downtown Cancun and the Hotel Zone. November and December ease from October’s peak but are not as dry as March and April.
Humidity and Wind
Humidity is high year-round, with September and October the most humid months on average. Average wind changes little through the year, ranging from about 6 mph (10 km/h) in August and September to 8 mph (13 km/h) in March.
These monthly averages cannot show the stronger winds that may accompany a passing front, hurricane or other storm. Check the current forecast for your exact dates, especially for boat trips and other weather-sensitive plans.
Cancun Sea Temperature by Month
| Month | Avg sea temperature | Month | Avg sea temperature |
|---|---|---|---|
| January | 80°F / 27°C | July | 84°F / 29°C |
| February | 79°F / 26°C | August | 84°F / 29°C |
| March | 80°F / 26°C | September | 85°F / 29°C |
| April | 81°F / 27°C | October | 84°F / 29°C |
| May | 82°F / 28°C | November | 82°F / 28°C |
| June | 83°F / 28°C | December | 81°F / 27°C |
The sea stays warm throughout the year, averaging about 79°F (26°C) in February and 85°F (29°C) in September. These are offshore averages near Cancun. Water at a particular beach may be warmer or cooler depending on the weather, currents and water depth.
What Rainfall Averages Mean for Your Trip
Rain can be heavy at times in Cancun, but a downpour may be followed by bright sunshine an hour later. I have often seen rain downtown while the Hotel Zone, only a short distance away, stayed dry.
A forecast percentage does not say that it will rain for that percentage of the day, or describe how heavy or widespread the rain will be. It is common to see some chance of rain on every day of a forecast during wetter parts of the year and still get long spells of sunshine. Use a current local forecast for timing, but do not treat a rain icon as an all-day washout.
Want to see the weather right now? View a collection of live Cancun webcams for current sky and ocean conditions.